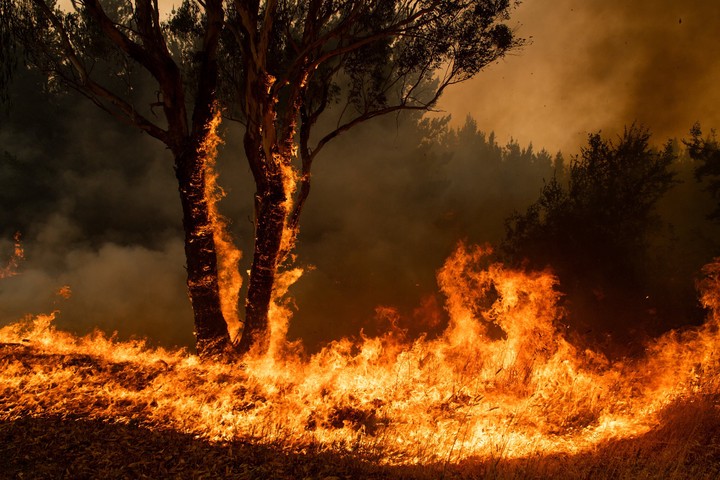
During the end of 2019, wildfires proliferated across Australia. As part of the R For Data Science TidyTuesday series, I analyzed Australian temperature and rainfall data to attempt to discern potential contributers to the historic and devastating 2019 Australia bush fires. The visualizations below were created using R. All code can be found on github here.
Fire Locations
Are Temperatures Increasing?
A quick analysis shows that average annual temperatures have increased in almost all cities over the past 75 years.

Less Rainfall?
The data also shows a trend for decreasing amounts of rainfall.

