We specialize in interactive data visualization because information is increasingly presented in modern, web-based forums. We utilize popular open source tools such as plotly, leaflet, and ggplot to produce visually pleasing and effective maps and charts which distill messy data into actionable information.
Distribution Plots
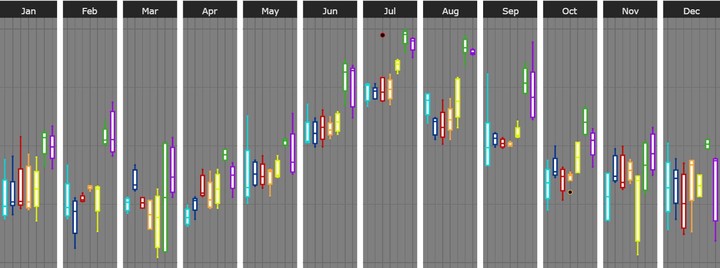
Box & Whisker Plots
Raw Observations Grouped
Facetted Plots
Tile Grids
Time Series Charts
Stacked Charts
Interactive Maps
tm_shape(all) + tm_polygons()## Warning: Currect projection of shape all unknown. Long-lat (WGS84) is assumed.